


HANGZHOU, China–(BUSINESS WIRE)–Alibaba Group Holding Limited (NYSE: BABA and HKEX: 9988 (HKD Counter) and 89988 (RMB Counter), “Alibaba” or “Alibaba Group”) today announced its financial results for the quarter ended September 30, 2023.

“Alibaba Group delivered a solid quarter, marked by renewed momentum and energy across multiple businesses as a result of our strategic reorganization. As we embark on a new phase of development, we have clearly defined our strategic focus and priorities. We will maintain an entrepreneurial mindset. We are committed to investing for growth and making bold decisions where necessary. Through a more flexible organizational governance mechanism, we aim to capture brand new opportunities from the ongoing AI technological transformation and create more value for our customers,” said Eddie Wu, Chief Executive Officer of Alibaba Group.
“We achieved a stable quarter with revenue increasing 9% year-over-year and income from operations and adjusted EBITA increasing 34% and 18% year-over-year, respectively,” said Toby Xu, Chief Financial Officer of Alibaba Group. “Under our capital management plan, we are prioritizing investment in technology and innovations for our businesses to drive new growth. We are confident in our business fundamentals and are pleased to announce our first annual dividend distribution for fiscal year 2023, with an aggregate amount of approximately US$2.5 billion, as part of our continued efforts to enhance shareholders’ return in addition to the ongoing share repurchase program.”
BUSINESS HIGHLIGHTS
In the quarter ended September 30, 2023:
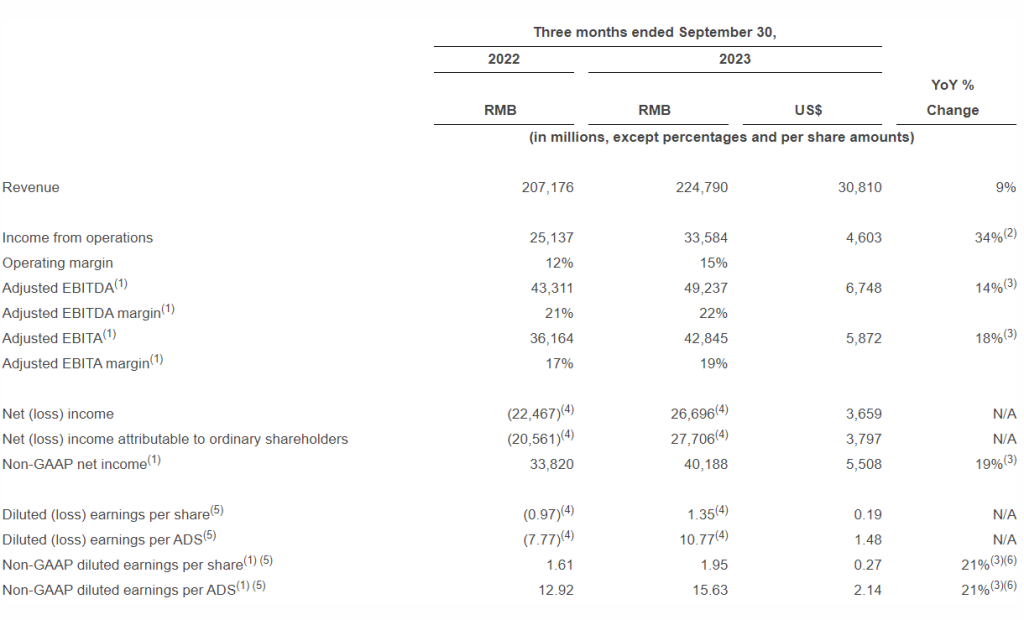
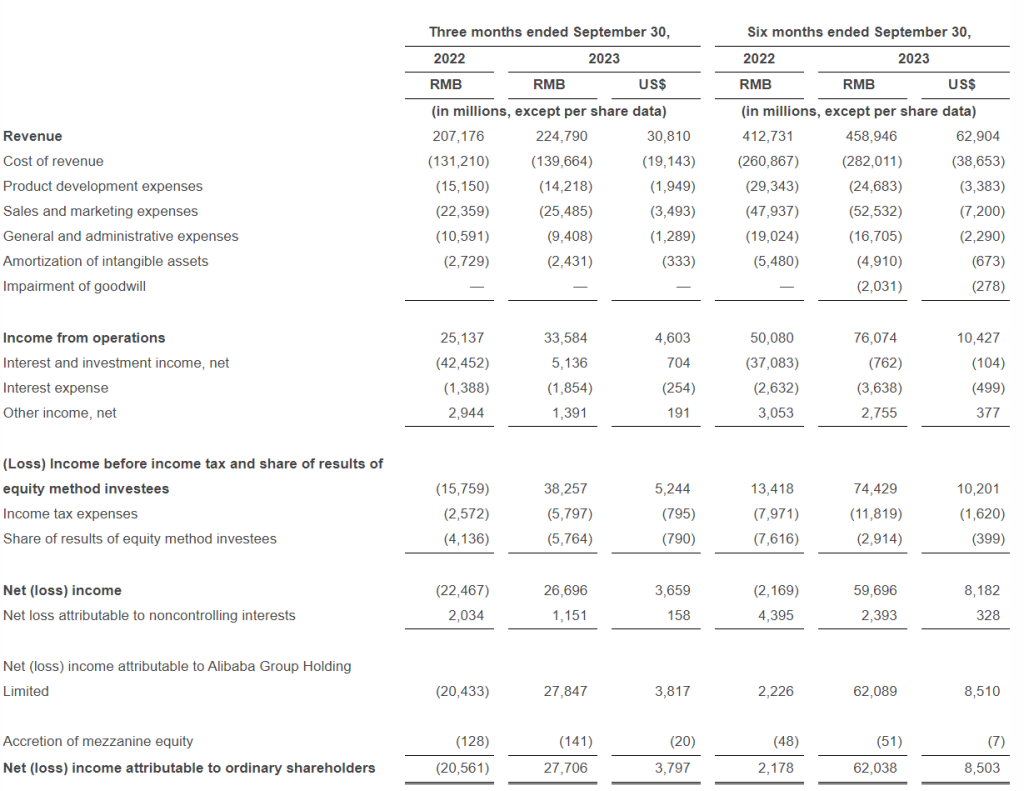
- Revenue was RMB224,790 million (US$30,810 million), an increase of 9% year-over-year.
- Income from operations was RMB33,584 million (US$4,603 million), an increase of 34% year-over-year. The year-over-year increase was primarily attributable to an increase in adjusted EBITA, as well as a decrease in share-based compensation expense. We excluded share-based compensation expense from our non-GAAP measurements. Adjusted EBITA, a non-GAAP measurement, increased 18% year-over-year to RMB42,845 million (US$5,872 million).
- Net income attributable to ordinary shareholders was RMB27,706 million (US$3,797 million). Net income was RMB26,696 million (US$3,659 million), compared to net loss of RMB22,467 million in the same quarter of 2022, primarily attributable to a net gain arising from the increase in fair value of our equity investments, compared to a net loss from these investments in the same quarter last year, and an increase in adjusted EBITA. We excluded net gains or losses arising from the changes in fair value of our investments from our non-GAAP measurements. Non-GAAP net income was RMB40,188 million (US$5,508 million), an increase of 19% year-over-year.
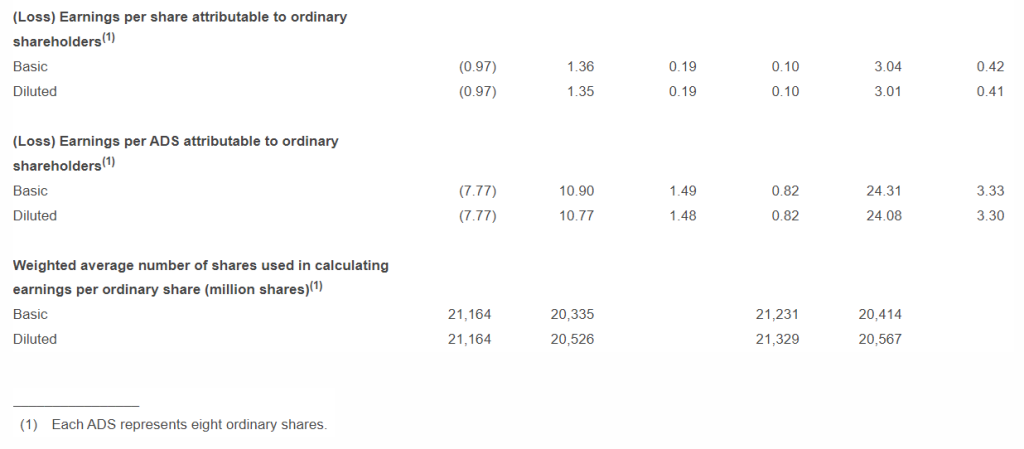
- Diluted earnings per ADS was RMB10.77 (US$1.48) and diluted earnings per share was RMB1.35 (US$0.19 or HK$1.47). Non-GAAP diluted earnings per ADS was RMB15.63 (US$2.14), an increase of 21% year-over-year and non-GAAP diluted earnings per share was RMB1.95 (US$0.27 or HK$2.13), an increase of 21% year-over-year.
- Net cash provided by operating activities was RMB49,231 million (US$6,748 million), an increase of 4% compared to RMB47,112 million in the same quarter of 2022. Free cash flow, a non-GAAP measurement of liquidity, was RMB45,220 million (US$6,198 million), an increase of 27% compared to RMB35,709 million in the same quarter of 2022.
BUSINESS AND STRATEGIC UPDATES
Taobao and Tmall Group
Our Taobao and Tmall Group’s strategy is to put users first, build an ecosystem for brands and merchants to thrive on our platform, and realize AI technology-driven innovation. Taobao app is at the core of this strategy as a one-stop destination for consumption and daily life needs serving the largest number of users. We continue to improve the value proposition of Taobao app by (i) increasing content to encourage user engagement, (ii) enhancing price-competitive product supply by onboarding more merchants and targeting more effectively, and (iii) introducing AI applications and tools to improve user experience and seller efficiency.
For the month ended September 30, 2023, we achieved healthy year-over-year organic growth of Taobao app users as a result of our content and price-competitive strategy. Our investments to provide more interactive content led to strong growth in user time spent on short-form video content. Importantly, the number of transacting buyers and order volume also increased during the quarter, as we continue to increase interactive content and broaden assortment of price-competitive products offered by both existing and new merchants. In addition, the number of 88VIP members increased double-digits year-over-year, surpassing 30 million during the quarter. Taobao and Tmall Group successfully concluded its 15th annual 11.11 Global Shopping Festival, which recorded positive year-over-year growth in participating merchants, transacting buyers and order volume compared to the same period last year.
Taobao and Tmall Group continues to expand AI products and services for its merchant operation platform and monetization platform (Alimama). It now offers AI tools that simplify and automate online store operations, such as new store design, product photo and description generation, customer service and financial and order management, all of which improve merchants’ operating efficiency. Additionally, in August, Taobao and Tmall Group upgraded one of its key advertising platforms, Wanxiangtai Unbounded Edition (万相台无界版), with the aim of growing the number of merchants who advertise with us by facilitating them to allocate their advertising budgets in all available properties within the Alibaba ecosystem using a single interface. The updated edition features AI technologies that provide (i) data analysis and insights to optimize advertising spending, (ii) marketing tools that intelligently locate targeted customers and (iii) AI-generated content for advertising. These proprietary AI technologies enhance merchants’ efficiency and improve conversion and return on investment for merchants. We have seen strong adoption of Wanxiangtai Unbounded Edition by both new and existing merchants during the quarter.
Xianyu (闲鱼), a fun community and marketplace, continues to grow strongly with DAU up over 20% year-over-year in the month ended September 30, 2023. Through Xianyu, users can find a rich variety of secondhand, recycled, for-rent and vintage products as well as interest-based content. Its revenue, which consists of advertising, commission and value-added services such as fees from product recycling, consignment sales and product inspection, grew rapidly year-over-year during the quarter.
Alibaba International Digital Commerce Group (“AIDC”)
Alibaba International Digital Commerce Group operates various retail and wholesale marketplaces including Lazada, AliExpress, Trendyol, Daraz, Miravia and Alibaba.com. During the September quarter, the combined order growth of AIDC’s retail businesses was approximately 28% year-over-year, driven by solid performance from all major retail platforms. During the quarter, revenue from AIDC exhibited robust growth, increasing by 53% year-over-year.
AliExpress is executing its growth strategy under multiple business models – the established marketplace business, which saw double-digit growth year-over-year in the number of orders during this quarter, and Choice, a new model launched in early 2023 through which AliExpress delivers enhanced experience to consumers by working with merchants to ensure better control of product selection and quality as well as speed of logistics. Choice works closely with Cainiao to improve consumer experience, recently rolling out a 5-day delivery guarantee program in selected European countries. As a result the order volume of Choice ramped up rapidly during the quarter.
Lazada recorded double-digit order growth year-over-year during the quarter. Lazada continues to focus on improving monetization. As a result, losses per order narrowed quarter-over-quarter and year-over-year.
Trendyol delivered robust order growth while investing in its expansion outside Türkiye. By leveraging its product sourcing capabilities and supply chain advantages, Trendyol further expanded its footprint in the region.
Local Services Group
For the quarter ended September 30, 2023, revenue from Local Services Group grew 16% year-over-year to RMB15,564 million (US$2,133 million), driven by strong growth in both Ele.me and Amap businesses. During this quarter, order growth of Local Services Group was nearly 20% year-over-year. Annual active consumers of Local Services Group for the twelve months ended September 30, 2023 continued to grow quarter-over-quarter due to improved acquisition and retention of consumers as well as increasing user demand. For this quarter, its losses continued to narrow driven by improving overall business scale and efficiency.
To-Home
For the quarter ended September 30, 2023, Ele.me’s overall order volume, consisting of both restaurant and non-restaurant orders, grew year-over-year and quarter-over-quarter driven by increasing number of transacting users and higher purchase frequency per user. As a result of successful marketing campaigns, Ele.me’s restaurant delivery orders grew by double-digits year-over-year this quarter. In addition, Ele.me is making significant progress in the non-restaurant delivery category. During the quarter, non-restaurant delivery orders also grew by double-digits year-over-year, driven by strong consumer demands during festivals and marketing campaigns, such as flower delivery on Chinese Valentine’s Day, “24/7 Medicine Delivery” service campaign, and new iPhone 15 launch on September 22, 2023. For the quarter ended September 30, 2023, Ele.me’s losses continued to narrow year-over-year driven by improving operating efficiency and increasing scale.
To-Destination
For the quarter ended September 30, 2023, order growth of Amap increased rapidly year-over-year, due to its strengthening position as a comprehensive “To-Destination” service platform as well as strong travel demand during this summer season. During an eight-day holiday period from September 29 to October 6 that combined Mid-Autumn Festival and National Day holiday, Amap recorded an all-time high of over 280 million peak daily active users as the Chinese economy experienced strong recovery in travel demand.
Cainiao Smart Logistics Network Limited (“Cainiao”)
For the quarter ended September 30, 2023, revenue from Cainiao grew 25% year-over-year to RMB22,823 million (US$3,128 million), primarily driven by revenue from cross-border fulfillment solutions.
Cainiao continues to execute its strategy of building a global smart logistics network, reinforcing comprehensive end-to-end capabilities in cross-border logistics solutions. During the quarter, Cainiao rolled out its premium 5-day delivery service for consumers in eight countries and regions. The project leverages Cainiao’s comprehensive capabilities in full-chain operational optimization across first-mile pick-up, line haul, customs clearance, sortation, and last-mile delivery.
Cainiao leverages technology to remain competitive. To support AliExpress’ Choice expansion, Cainiao provided parcel bundling and direct shipping capabilities through data analytics and algorithms that reduce delivery time and improve efficiency.
Cloud Intelligence Group
For the quarter ended September 30, 2023, revenue from Cloud Intelligence Group was RMB27,648 million (US$3,789 million), a growth of 2% year-over-year.
We continue to improve revenue quality by reducing the revenue from project-based contracts that are of low margins. On the other hand, revenues from public cloud products and services increased during this quarter which drove improved profitability.
From October 31 to November 2, we held our 15th annual cloud computing developer summit and exhibition, the Apsara Conference 2023, during which Alibaba Cloud Intelligence Group unveiled new technologies that had been under development. Highlights of our proprietary technologies include:
- Generative AI Models: Alibaba’s proprietary large language model (LLM) Tongyi Qianwen (通义千问) launched an upgraded 2.0 version, with strong capabilities in understanding complex instructions, reasoning, memorizing and reducing hallucination. We also rolled out eight vertical models for specific industries including finance and gaming, as well as business enhancement capabilities such as code generation and customer support.
- Ecosystem: We have built one of the largest open-source AI developer communities in China. Our developer community ModelScope has gathered over 2,300 AI models, attracting 2.8 million AI developers and over 100 million cumulative model downloads since the launch of this community. We are also making available the open-source version of our Tongyi Qianwen models in ModelScope, which we have announced will include a version with 72 billion-parameter after the launch of our 7 billion-parameter and 14 billion-parameter models.
- Alibaba Cloud Bailian (阿里云百炼): One-stop AI application development platform Alibaba Cloud Bailian, which provides LLM application development services in one single platform offering a range of high performing foundation models including those from third parties. It simplifies the large model training process and allows developers to focus on model application innovation. In addition, it provides a secure environment for customer data protection during the training process.
Alibaba Cloud supported the first “Asian Games on the Cloud,” to facilitate more intelligent, sustainable, sophisticated and efficient Asian Games. Using cloud-native technology running on Alibaba Cloud’s container services, we enabled more agile, scalable and efficient operations of the event.
Digital Media and Entertainment Group
During the quarter ended September 30, 2023, revenue of Digital Media and Entertainment Group was RMB5,779 million (US$792 million), an increase of 11% year-over-year, driven by strong revenue growth of offline entertainment businesses of Damai and Alibaba Pictures, as well as increase in Youku’s subscription revenue, partly offset by the decrease in Youku’s advertising revenue.
Businesses within the segment continue to achieve synergies. On September 19, 2023, Alibaba Pictures announced its acquisition of Damai, aiming to leverage Damai’s leading position in the offline performance market to expand influence in the offline entertainment industry. Benefiting from the recovery of offline entertainment market and strong demand in the summer, Damai maintained its industry-leading position with triple-digit GMV growth and improving profitability year-over-year during the quarter. In August, Damai and Youku jointly sold tickets of TFBoys’ 10th anniversary concert, for offline performance and online broadcasting, respectively. The exclusive online broadcasting attracted more than 1.68 million viewers and achieved more than 100 million times of interaction, which broke the record for online paid performances on Youku.
China’s box office during the summer movie season hit record high this year. No More Bets (孤注一掷) and Lost in the Stars (消失的她), both co-produced by Alibaba Pictures, were the top two performers in terms of box office in China during summer vacation. Chang’an (长安三万里), an animation for which Alibaba Pictures was the co-producer, leading promoter and distributor, was the best performing animation movie in terms of box office so far in 2023.
All Others
DingTalk
Starting from the quarter ended September 30, 2023, we reclassified the result of our DingTalk business, which was previously reported under Cloud Intelligence Group to All others, the purpose of which was to provide DingTalk with greater autonomy to promote innovation and enhance competitiveness.
DingTalk, our digital collaboration workplace and application development platform, offers new ways of working, sharing and collaboration through the integration of latest AI models. As of September 30, 2023, 17 product lines of DingTalk had been fully integrated with large models. DingTalk also opened up its intelligent AI PaaS platform to customers and ecosystem partners, which will help participants in the ecosystem reinvent their products.
Intelligent Information Platform
Our Intelligent Information Platform includes Quark (夸克), UCWeb, and other businesses. During the month ended September 30, 2023, Quark continued to grow strongly with DAUs up over 35% year-over-year. Quark provides young users with a one-stop platform for information search, storage and consumption. It offers tools and services, such as smart search, Quark cloud drive, AI camera, Quark learning and Quark documents, to help users better acquire and utilize a variety of digital content and information for learning and work purposes.
Fliggy
Fliggy, a leading online travel platform, provides comprehensive services to meet consumers’ travel needs. During the quarter ended September 30, 2023, Fliggy’s GMV increased rapidly year-over-year driven by strong recovery in both domestic and international travel demands.
Updates on ESG Initiatives
Empowering More Sustainable and Inclusive Asian Games
Alibaba Group contributed to promote the sustainability and inclusiveness of the 19th Asian Games and the 4th Asian Para Games in Hangzhou.
- Alibaba Cloud introduced its digital avatar, Xiaomo (小莫), which supports two-way translation between sign language and Chinese spoken language. Xiaomo provided on-site assistance to audience with hearing impairments during the Asian Para Games.
- Amap, by leveraging its “Wheelchair Navigation” feature, assisted Hangzhou Disabled Persons’ Federation in the technological upgrade of its “Online Accessible Service” platform in order to provide users with more detailed accessible travel planning and navigation services.
Enhancing Community Resilience
In August 2023, Alibaba Foundation donated RMB30 million to support Typhoon “Doksuri” rescue efforts in Beijing, Tianjin, Hebei Province and other regions. Alibaba Philanthropy mobilized Freshippo (Hema), RT-Mart, 1688.com and other businesses to strengthen supply chains and distribute emergency supplies across severely impacted regions. Alibaba Philanthropy Platform has also launched an online flood relief initiative which provides public fundraising channels for other non-profit organizations.
Impacts of Recent U.S. Export Controls Expansion
In October 2023, the United States expanded its export control rules to further restrict the export to China of advanced computing chips and semiconductor manufacturing equipment. We believe that these new restrictions may materially and adversely affect Cloud Intelligence Group’s ability to offer products and services and to perform under existing contracts, thereby negatively affecting our results of operations and financial condition. These new restrictions may also affect our businesses more generally by limiting our ability to upgrade our technological capabilities.
Update on Business Group Spin-offs and Capital Raisings
Cloud Intelligence Group
The recent expansion of U.S. restrictions on export of advanced computing chips has created uncertainties for the prospects of Cloud Intelligence Group. We believe that a full spin-off of Cloud Intelligence Group may not achieve the intended effect of shareholder value enhancement. Accordingly, we have decided to not proceed with a full spin-off, and instead we will focus on developing a sustainable growth model for Cloud Intelligence Group under the fluid circumstances.
Alibaba International Digital Commerce Group
Alibaba International Digital Commerce Group is in preparation for external fundraising.
Cainiao
Cainiao Smart Logistics Network Limited has applied for an initial public offering in Hong Kong and has submitted its A1 filing to the Hong Kong Stock Exchange.
Freshippo (Hema)
Freshippo (Hema)’s plan for an initial public offering has been put on hold as we evaluate market conditions and other factors that would contribute to a successful transaction to enhance shareholder value.
Shareholder Return Activities
Our board of directors has approved an annual cash dividend for fiscal year 2023 in the amount of US$0.125 per ordinary share or US$1.00 per ADS, payable in U.S. dollars, to holders of ordinary shares and holders of ADSs, as of the close of business on December 21, 2023, Hong Kong Time and New York Time, respectively. The aggregate amount of the dividend will be approximately US$2.5 billion. Going forward, we will continue to review and determine the dividend amount based on factors such as business fundamentals, capital requirements, among others, on an annual basis.
For holders of ordinary shares, in order to qualify for the dividend, all valid documents for the transfers of shares accompanied by the relevant share certificates must be lodged with the Company’s Hong Kong branch share registrar, Computershare Hong Kong Investor Services Limited, at Shops 1712-1716, 17th Floor, Hopewell Centre, 183 Queen’s Road East, Wanchai, Hong Kong, not later than 4:30 p.m. on December 21, 2023, Hong Kong Time. The payment date is expected to be on or around January 11, 2024 for holders of ordinary shares and on or around January 18, 2024 for holders of ADSs.
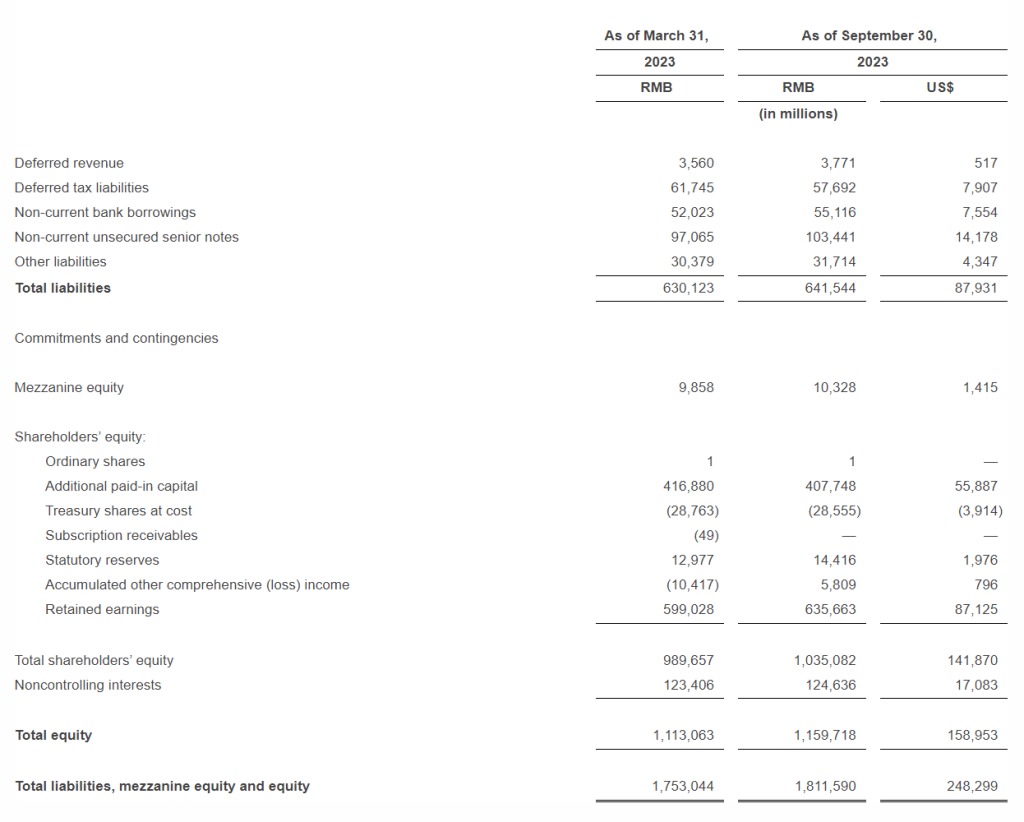
In addition, during the quarter ended September 30, 2023, we repurchased approximately 18.6 million ADSs (the equivalent of 148.4 million ordinary shares) for approximately US$1.7 billion under our share repurchase program. As of September 30, 2023, we had approximately 20.3 billion ordinary shares (the equivalent of 2.5 billion ADSs) outstanding, a reduction of 138.9 million ordinary shares (the equivalent of approximately 17.4 million ADSs) from last quarter, and US$14.6 billion remained under the current share buyback program authorized by the Board, which is effective through March 2025.
SEPTEMBER QUARTER SUMMARY FINANCIAL RESULTS
| ________________ | ||
| (1) | See the sections entitled “Non-GAAP Financial Measures” and “Reconciliations of Non-GAAP Measures to the Nearest Comparable U.S. GAAP Measures” for more information about the non-GAAP measures referred to within this results announcement. | |
| (2) | The year-over-year increase was primarily attributable to an increase in adjusted EBITA, as well as a decrease in share-based compensation expense. | |
| (3) | The year-over-year increases were primarily contributed by revenue growth and improved operating efficiency. | |
| (4) | The year-over-year change was primarily attributable to a net gain arising from the increase in fair value of our equity investments, compared to a net loss from these investments in the same quarter last year, and an increase in adjusted EBITA. | |
| (5) | Each ADS represents eight ordinary shares. | |
| (6) | The year-over-year percentages as stated are calculated based on the exact amount and there may be minor differences from the year-over-year percentages calculated based on the RMB amounts after rounding. | |
SEPTEMBER QUARTER SEGMENT RESULTS
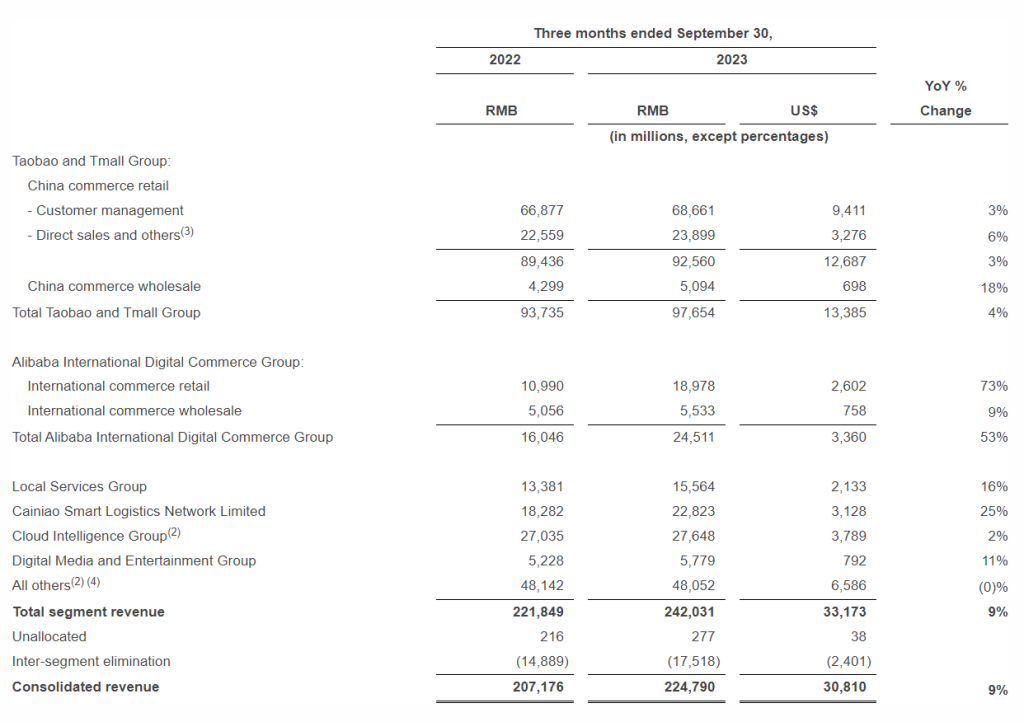
Revenue for the quarter ended September 30, 2023 was RMB224,790 million (US$30,810 million), an increase of 9% year-over-year compared to RMB207,176 million in the same quarter of 2022.
Starting from the quarter ended June 30, 2023, we have implemented a new organizational structure which includes six major business groups and various other businesses (the “Reorganization”). Our segment reporting has been updated to reflect our Reorganization and how our chief operating decision maker (“CODM”) review information under our new structure.
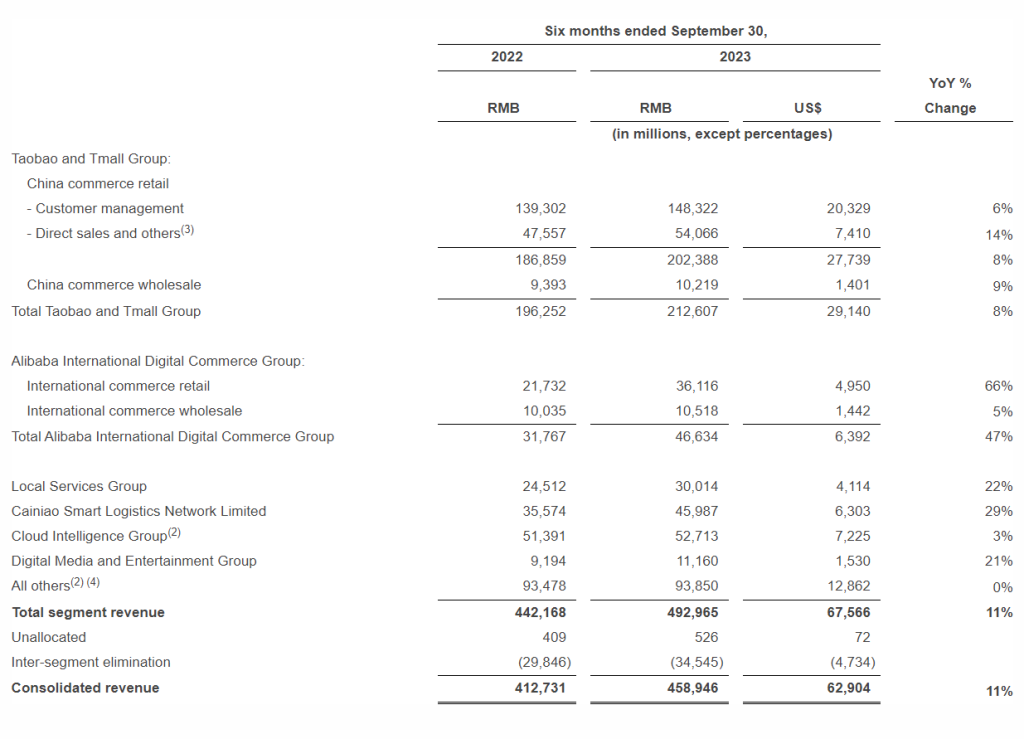
The following table sets forth a breakdown of our revenue by segment for the periods indicated(1):
________________
(1)Starting from the quarter ended June 30, 2023, our segment reporting has been updated to reflect our Reorganization. Our CODM started to review information under a new reporting structure, and segment reporting has been updated to conform to this change. Comparative figures were reclassified to conform to this presentation.
(2)Starting from the quarter ended September 30, 2023, we reclassified the revenue of our DingTalk business, which was previously reported under Cloud Intelligence Group to All others, the purpose of which was to provide DingTalk with greater autonomy to promote innovation and enhance competitiveness. This reclassification conforms to the way that we manage and monitor segment performance. Comparative figures were reclassified to conform to this presentation.
(3)Direct sales and others revenue under Taobao and Tmall Group primarily represents our direct sales businesses, including Tmall Supermarket, Tmall Global and other direct sales businesses, where revenue and cost of inventory are recorded on a gross basis.
(4)All others include Sun Art, Freshippo, Alibaba Health, Lingxi Games, Intime, Intelligent Information Platform (which mainly consists of UCWeb and Quark businesses), Fliggy, DingTalk (previously reported under Cloud Intelligence Group segment) and other businesses. The majority of revenue within all others consist of direct sales revenue, which is recorded on a gross basis.
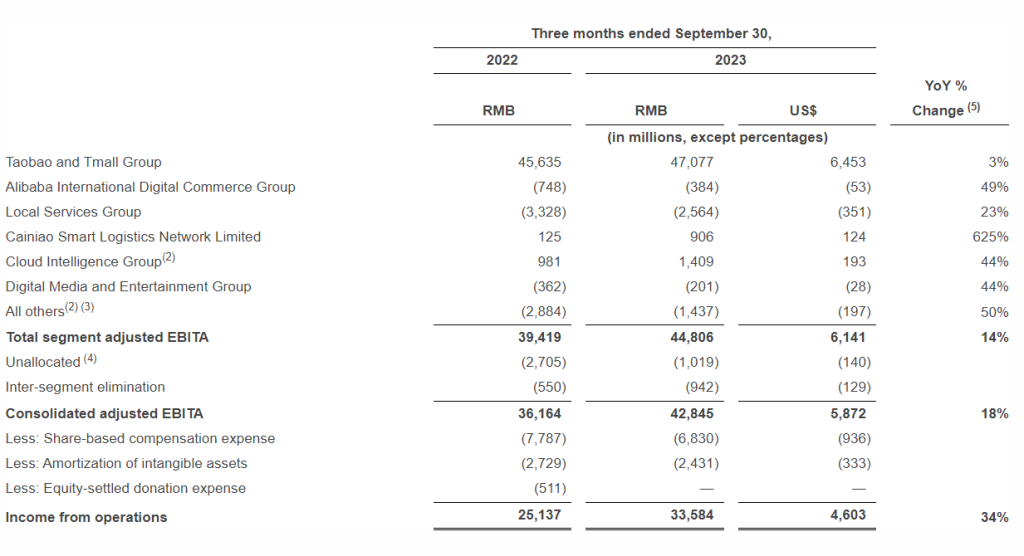
The following table sets forth a breakdown of our adjusted EBITA by segment for the periods indicated(1):
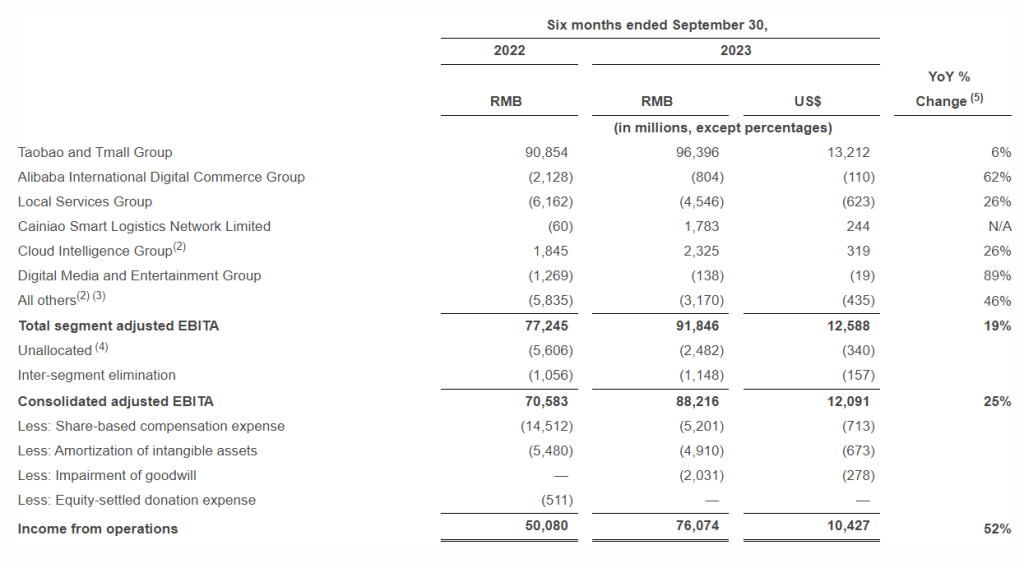
________________
(1)Starting from the quarter ended June 30, 2023, our segment reporting has been updated to reflect our Reorganization. Our CODM started to review information under a new reporting structure, and segment reporting has been updated to conform to this change. Comparative figures were reclassified to conform to this presentation.
(2)Starting from the quarter ended September 30, 2023, we reclassified the result of our DingTalk business, which was previously reported under Cloud Intelligence Group to All others, the purpose of which was to provide DingTalk with greater autonomy to promote innovation and enhance competitiveness. This reclassification conforms to the way that we manage and monitor segment performance. Comparative figures were reclassified to conform to this presentation.
(3)All others include Sun Art, Freshippo, Alibaba Health, Lingxi Games, Intime, Intelligent Information Platform (which mainly consists of UCWeb and Quark businesses), Fliggy, DingTalk (previously reported under Cloud Intelligence Group segment) and other businesses.
(4)Unallocated primarily relate to certain costs incurred by corporate functions and other miscellaneous items that are not allocated to individual segments.
(5)For a more intuitive presentation, widening of loss in YoY% is shown in terms of negative growth rate, and narrowing of loss in YoY% is shown in terms of positive growth rate.
Taobao and Tmall Group
(i) Segment revenue
- China Commerce Retail Business
Revenue from our China commerce retail business in the quarter ended September 30, 2023 was RMB92,560 million (US$12,687 million), an increase of 3% compared to RMB89,436 million in the same quarter of 2022.
Customer management revenue increased by 3% year-over-year, primarily due to the increase in merchant’s willingness to invest in advertising, partly offset by the modest decline in online GMV generated on Taobao and Tmall, excluding unpaid order.
Direct sales and others revenue under China commerce retail business in the quarter ended September 30, 2023 was RMB23,899 million (US$3,276 million), an increase of 6% compared to RMB22,559 million in the same quarter of 2022, primarily due to strong sales driven by the consumer electronics and appliances.
- China Commerce Wholesale Business
Revenue from our China commerce wholesale business in the quarter ended September 30, 2023 was RMB5,094 million (US$698 million), an increase of 18% compared to RMB4,299 million in the same quarter of 2022, primarily due to an increase in revenue from value-added services provided to paying members.
(ii) Segment adjusted EBITA
Taobao and Tmall Group adjustedEBITA increased by 3% to RMB47,077 million (US$6,453 million) in the quarter ended September 30, 2023, compared to RMB45,635 million in the same quarter of 2022. The increase was primarily due to narrowing losses in certain businesses and increase in profit from customer management service, partly offset by the increase in investment in user acquisition and retention as well as in content of Taobao app.
Alibaba International Digital Commerce Group
(i) Segment revenue
- International Commerce Retail Business
Revenue from our International commerce retail business in the quarter ended September 30, 2023 was RMB18,978 million (US$2,602 million), an increase of 73% compared to RMB10,990 million in the same quarter of 2022. The increase in revenue was primarily due to strong combined order growth of AIDC’s retail businesses driven by the solid performance of all major retail platforms, the revenue contribution from AliExpress’ Choice, a new model launched in early 2023, and improvements in monetization. Because certain of our international businesses generate revenue in local currencies while our reporting currency is Renminbi, AIDC’s revenue is affected by exchange rate fluctuations.
- International Commerce Wholesale Business
Revenue from our International commerce wholesale business in the quarter ended September 30, 2023 was RMB5,533 million (US$758 million), an increase of 9% compared to RMB5,056 million in the same quarter of 2022. The increase was primarily due to an increase in revenue generated by cross-border related value-added services.
(ii) Segment adjusted EBITA
Alibaba International Digital Commerce Group adjusted EBITA was a loss of RMB384 million (US$53 million) in the quarter ended September 30, 2023, compared to a loss of RMB748 million in the same quarter of 2022. Losses significantly narrowed year-over-year primarily because of improved margins of Lazada and Trendyol, partly offset by the increase in investment in new business, such as Miravia, and AliExpress’ Choice. Lazada reduced loss mainly due to improvement in monetization. Trendyol continued to be profitable during the quarter, mainly due to improvements in monetization and operating efficiency.
Local Services Group
(i) Segment revenue
Revenue from Local Services Group was RMB15,564 million (US$2,133 million) in the quarter ended September 30, 2023, an increase of 16% compared to RMB13,381 million in the same quarter of 2022, primarily due to the strong growth in both Ele.me and Amap businesses.
(ii) Segment adjusted EBITA
Local Services Group adjusted EBITA was a loss of RMB2,564 million (US$351 million) in the quarter ended September 30, 2023, compared to a loss of RMB3,328 million in the same quarter of 2022, primarily due to the continued narrowing of loss from our “To-Home” business driven by Ele.me’s improved unit economics per order and increasing scale.
Cainiao Smart Logistics Network Limited
(i) Segment revenue
Revenue from Cainiao Smart Logistics Network Limited was RMB22,823 million (US$3,128 million) in the quarter ended September 30, 2023, an increase of 25% compared to RMB18,282 million in the same quarter of 2022, primarily contributed by the increase in revenue from cross-border fulfillment solutions.
(ii) Segment adjusted EBITA
Cainiao Smart Logistics Network Limited adjusted EBITA was RMB906 million (US$124 million) in the quarter ended September 30, 2023, compared to RMB125 million in the same quarter of 2022. The year-over-year increase was primarily because of improved operating results from cross-border fulfillment solutions, technology and other services, as well as domestic logistics services.
Cloud Intelligence Group
(i) Segment revenue
Revenue from Cloud Intelligence Group was RMB27,648 million (US$3,789 million) in the quarter ended September 30, 2023, an increase of 2% compared to RMB27,035 million in the same quarter of 2022. Year-over-year revenue growth was mainly driven by Alibaba-consolidated businesses. Revenue excluding Alibaba-consolidated businesses slightly decreased year-over-year, primarily due to our continued effort to improve revenue quality by reducing the revenue from project-based contracts that are of low margins, and such decrease was mostly offset by the increase in revenue from our public cloud products and services.
(ii) Segment adjusted EBITA
Cloud Intelligence Group adjustedEBITA increased by 44% to RMB1,409 million (US$193 million) in the quarter ended September 30, 2023, compared to RMB981 million in the same quarter of 2022, primarily due to improving product mix and operating efficiency.
Digital Media and Entertainment Group
(i) Segment revenue
Revenue from Digital Media and Entertainment Group was RMB5,779 million (US$792 million) in the quarter ended September 30, 2023, an increase of 11% compared to RMB5,228 million in the same quarter of 2022, primarily driven by the strong revenue growth of offline entertainment businesses of Damai and Alibaba Pictures, as well as the increase in Youku’s subscription revenue, partly offset by the decrease in Youku’s advertising revenue.
(ii) Segment adjusted EBITA
Digital Media and Entertainment Group adjusted EBITA in the quarter ended September 30, 2023 was a loss of RMB201 million (US$28 million), compared to a loss of RMB362 million in the same quarter of 2022. The improved adjusted EBITA was mainly due to the increase in profitability of Damai and Alibaba Pictures.
All Others
(i) Segment revenue
Revenue from all others segment, which was RMB48,052 million (US$6,586 million) in the quarter ended September 30, 2023, remained stable compared to RMB48,142 million in the same quarter of 2022, primarily due to the revenue growth contributed by Freshippo, Fliggy, Alibaba Health and Intelligent Information Platform, partly offset by the decrease in revenue from Sun Art due to decrease in ticket size resulting from the decrease in consumer stockpiling behavior compared to the same quarter last year.
(ii) Segment adjusted EBITA
Adjusted EBITA from all others segment in the quarter ended September 30, 2023 was a loss of RMB1,437 million (US$197 million), compared to a loss of RMB2,884 million in the same quarter of 2022, primarily due to improved operating results from Freshippo, DingTalk and Fliggy.
SEPTEMBER QUARTER OTHER FINANCIAL RESULTS
Costs and Expenses
The following tables set forth a breakdown of our costs and expenses, share-based compensation expense, and costs and expenses excluding share-based compensation expense by function for the periods indicated.
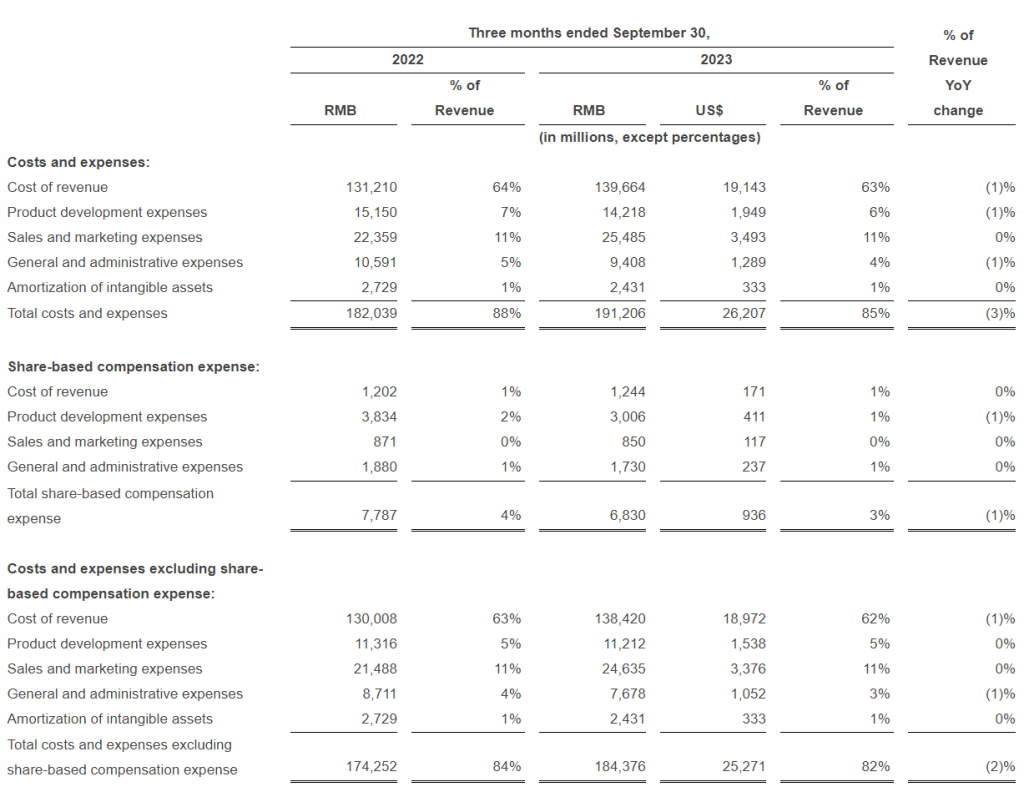
Cost of revenue – Cost of revenue in the quarter ended September 30, 2023 was RMB139,664 million (US$19,143 million), or 63% of revenue, compared to RMB131,210 million, or 64% of revenue, in the same quarter of 2022. Without the effect of share-based compensation expense, cost of revenue as a percentage of revenue would have decreased from 63% in the quarter ended September 30, 2022 to 62% in the quarter ended September 30, 2023.
Product development expenses – Product development expenses in the quarter ended September 30, 2023 were RMB14,218 million (US$1,949 million), or 6% of revenue, compared to RMB15,150 million, or 7% of revenue, in the same quarter of 2022. Without the effect of share-based compensation expense, product development expenses as a percentage of revenue would have remained stable at 5% in the quarter ended September 30, 2023 compared to the same quarter last year.
Sales and marketing expenses – Sales and marketing expenses in the quarter ended September 30, 2023 were RMB25,485 million (US$3,493 million), or 11% of revenue, compared to RMB22,359 million, or 11% of revenue, in the same quarter of 2022. Without the effect of share-based compensation expense, sales and marketing expenses as a percentage of revenue would have remained stable at 11% in the quarter ended September 30, 2023 compared to the same quarter last year.
General and administrative expenses – General and administrative expenses in the quarter ended September 30, 2023 were RMB9,408 million (US$1,289 million), or 4% of revenue, compared to RMB10,591 million, or 5% of revenue, in the same quarter of 2022. Without the effect of share-based compensation expense, general and administrative expenses as a percentage of revenue would have decreased from 4% in the quarter ended September 30, 2022 to 3% in the quarter ended September 30, 2023.
Share-based compensation expense – Total share-based compensation expense included in the cost and expense items above in the quarter ended September 30, 2023 was RMB6,830 million (US$936 million), compared to RMB7,787 million in the same quarter of 2022. Share-based compensation expense as a percentage of revenue decreased from 4% in the quarter ended September 30, 2022 to 3% in the quarter ended September 30, 2023.
The following table sets forth our analysis of share-based compensation expense for the quarters indicated by type of share-based awards:
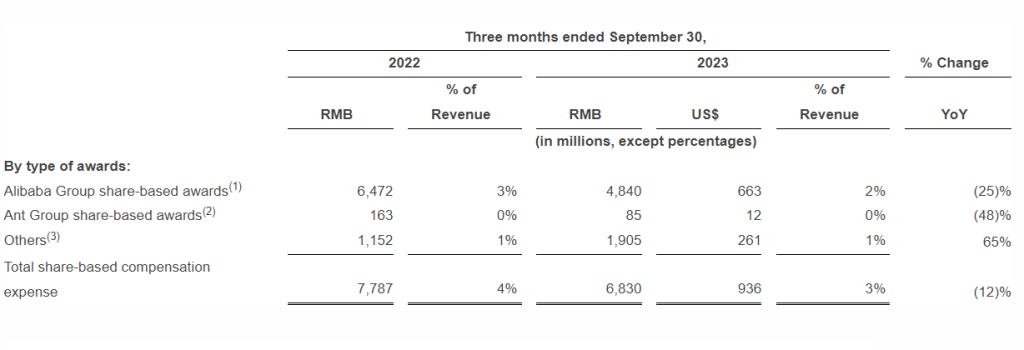
(1)This represents Alibaba Group share-based awards granted to our employees.
(2)This represents Ant Group share-based awards granted to our employees, which is subject to mark-to-market accounting treatment.
(3)This represents share-based awards of our subsidiaries.
Share-based compensation expense related to Alibaba Group share-based awards decreased in the quarter ended September 30, 2023 compared to the same quarter of 2022. This decrease was primarily due to the general decrease in the average fair market value of the awards granted.
We expect that our share-based compensation expense will continue to be affected by changes in the fair value of the underlying awards and the quantity of awards we grant in the future.
Amortization of intangible assets – Amortization of intangible assets in the quarter ended September 30, 2023 was RMB2,431 million (US$333 million), a decrease of 11% from RMB2,729 million in the same quarter of 2022.
Income from operations and operating margin
Income from operations in the quarter ended September 30, 2023 was RMB33,584 million (US$4,603 million), or 15% of revenue, an increase of 34% compared to RMB25,137 million, or 12% of revenue, in the same quarter of 2022, primarily attributable to an increase in adjusted EBITA, as well as a decrease in share-based compensation expense.
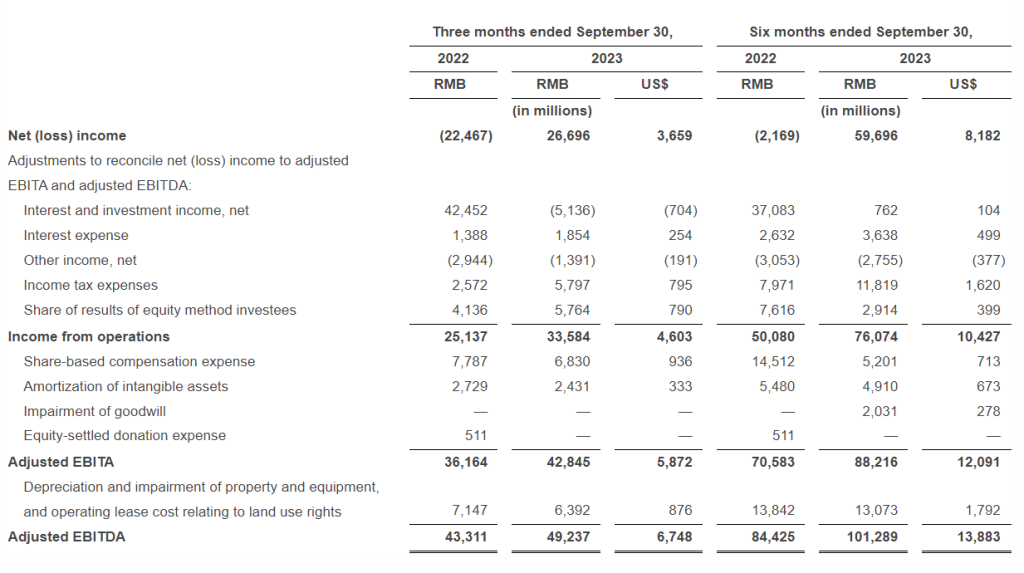
Adjusted EBITDA and Adjusted EBITA
Adjusted EBITDA increased 14% year-over-year to RMB49,237 million (US$6,748 million) in the quarter ended September 30, 2023, compared to RMB43,311 million in the same quarter of 2022. Adjusted EBITA increased 18% year-over-year to RMB42,845 million (US$5,872 million) in the quarter ended September 30, 2023, compared to RMB36,164 million in the same quarter of 2022, primarily contributed by revenue growth and improved operating efficiency. A reconciliation of net income (loss) to adjusted EBITDA and adjusted EBITA is included at the end of this results announcement.
Adjusted EBITA by segment
Adjusted EBITA by segment as well as a reconciliation of income from operations to adjusted EBITA are set forth in the section entitled “September Quarter Segment Results” above.
Interest and investment income, net
Interest and investment income, net in the quarter ended September 30, 2023 was a gain of RMB5,136 million (US$704 million), compared to a loss of RMB42,452 million in the same quarter of 2022, primarily due to a net gain arising from the increase in fair value of our equity investments, compared to a net loss from these investments in the same quarter last year.
The above-mentioned gains and losses were excluded from our non-GAAP net income.
Other income, net
Other income, net in the quarter ended September 30, 2023 was RMB1,391 million (US$191 million), compared to RMB2,944 million in the same quarter of 2022. The year-over-year decrease was primarily due to a decrease in net exchange gain arising from exchange rate fluctuation between Renminbi and U.S. dollar.
Income tax expenses
Income tax expenses in the quarter ended September 30, 2023 were RMB5,797 million (US$795 million), compared to RMB2,572 million in the same quarter of 2022.
Excluding share-based compensation expense, revaluation and disposal gains/losses of investments, impairment of investments, as well as the deferred tax effects on basis differences arising from our equity method investees, our effective tax rate would have been 18% in the quarter ended September 30, 2023.
Share of results of equity method investees
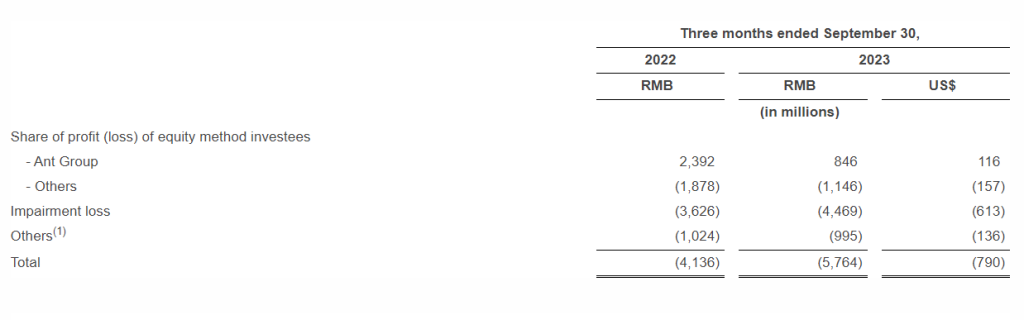
Share of results of equity method investees in the quarter ended September 30, 2023 was a loss of RMB5,764 million (US$790 million), compared to a loss of RMB4,136 million in the same quarter of 2022. The following table sets forth a breakdown of share of results of equity method investees for the periods indicated.
________________
(1)
“Others” mainly include basis differences arising from equity method investees, share-based compensation expense related to share-based awards granted to employees of our equity method investees, as well as gain or loss arising from the deemed disposal of the equity method investees.
We record our share of results of all equity method investees one quarter in arrears. The year-over-year decrease in share of profit of Ant Group which reflected a RMB7.07 billion fine on Ant Group imposed by PRC regulators announced in July 2023.
During the quarter ended September 30, 2023, Ant Group repurchased approximately 7% equity interest from its existing shareholders and the shares repurchased were allocated to the employee incentive plans of Ant Group. The number of shares held by us in Ant Group remains unchanged from legal perspective, our equity interest in Ant Group on a fully diluted basis remains unchanged at 33%.
For U.S. GAAP accounting purposes, we will take into consideration a proportionate share of equity interest held by the employee incentive plans of Ant Group to account for our share of results from our investment in Ant Group, subject to dilution as the equity interest under the employee incentive plans of Ant Group is transferred out.
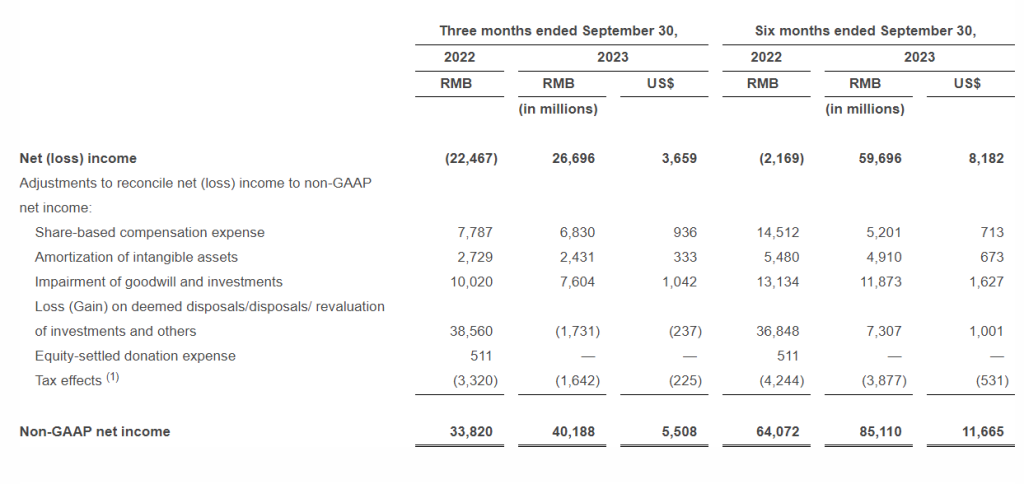
Net income (loss) and Non-GAAP net income
Our net income in the quarter ended September 30, 2023 was RMB26,696 million (US$3,659 million), compared to net loss of RMB22,467 million in the same quarter of 2022, which was primarily attributable to a net gain arising from the increase in fair value of our equity investments, compared to a net loss from these investments in the same quarter last year, and an increase in adjusted EBITA.
Excluding share-based compensation expense, revaluation and disposal gains/losses of investments, impairment of investments and certain other items, non-GAAP net income in the quarter ended September 30, 2023 was RMB40,188 million (US$5,508 million), an increase of 19% compared to RMB33,820 million in the same quarter of 2022. A reconciliation of net income (loss) to non-GAAP net income is included at the end of this results announcement.
Net income (loss) attributable to ordinary shareholders
Net income attributable to ordinary shareholders in the quarter ended September 30, 2023 was RMB27,706 million (US$3,797 million), compared to net loss attributable to ordinary shareholders of RMB20,561 million in the same quarter of 2022, which was primarily attributable to a net gain arising from the increase in fair value of our equity investments, compared to a net loss from these investments in the same quarter last year, and an increase in adjusted EBITA.
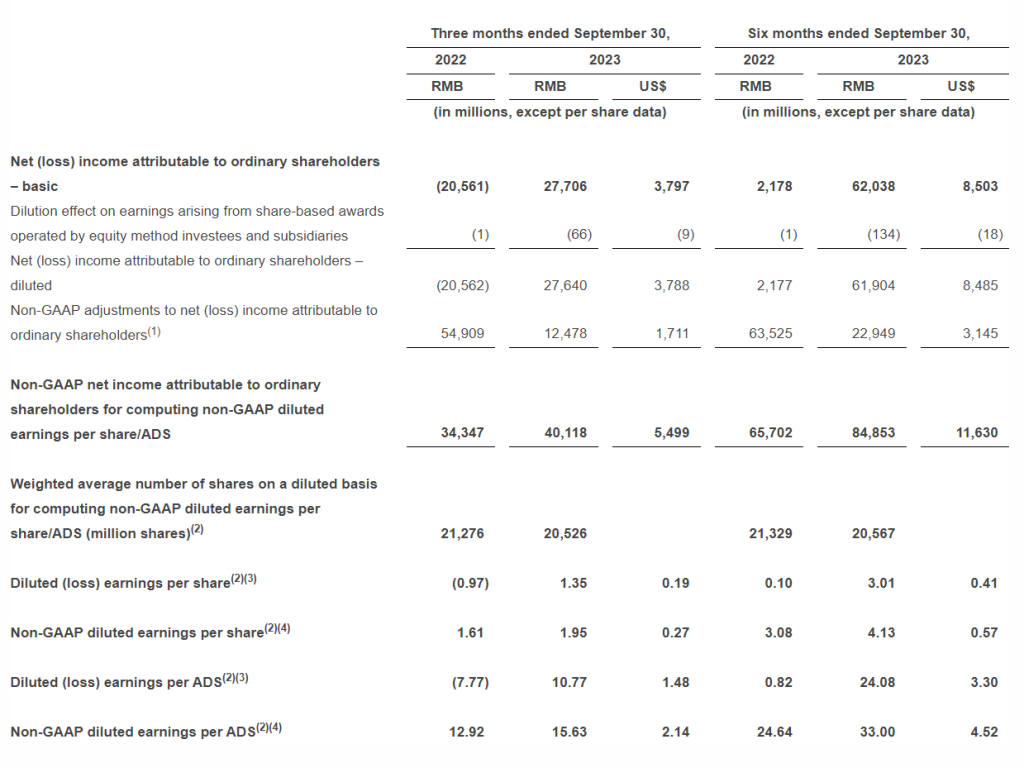
Diluted earnings (loss) per ADS/share and non-GAAP diluted earnings per ADS/share
Diluted earnings per ADS in the quarter ended September 30, 2023 was RMB10.77 (US$1.48), compared to diluted loss per ADS of RMB7.77 in the same quarter in 2022. Excluding share-based compensation expense, revaluation and disposal gains/losses of investments, impairment of investments and certain other items, non-GAAP diluted earnings per ADS in the quarter ended September 30, 2023 was RMB15.63 (US$2.14), an increase of 21% compared to RMB12.92 in the same quarter of 2022.
Diluted earnings per share in the quarter ended September 30, 2023 was RMB1.35 (US$0.19 or HK$1.47), compared to diluted loss per share of RMB0.97 in the same quarter of 2022. Excluding share-based compensation expense, revaluation and disposal gains/losses of investments, impairment of investments and certain other items, non-GAAP diluted earnings per share in the quarter ended September 30, 2023 was RMB1.95 (US$0.27 or HK$2.13), an increase of 21% compared to RMB1.61 in the same quarter of 2022.
A reconciliation of diluted earnings (loss) per ADS/share to non-GAAP diluted earnings per ADS/share is included at the end of this results announcement. Each ADS represents eight ordinary shares.
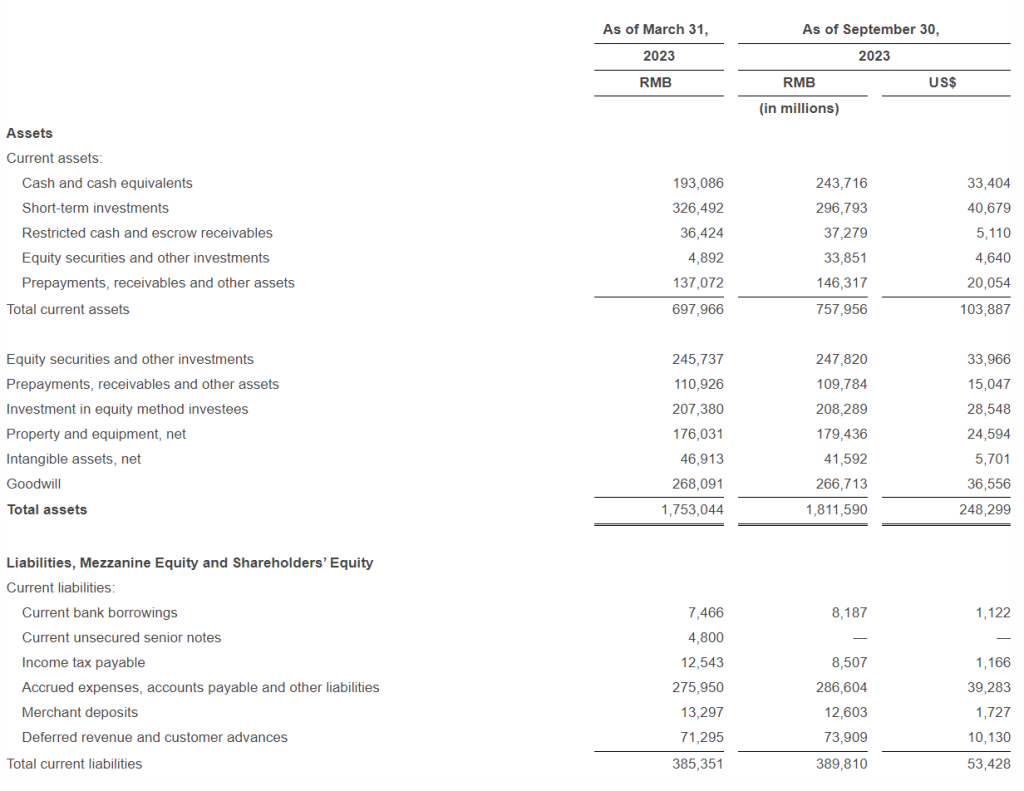
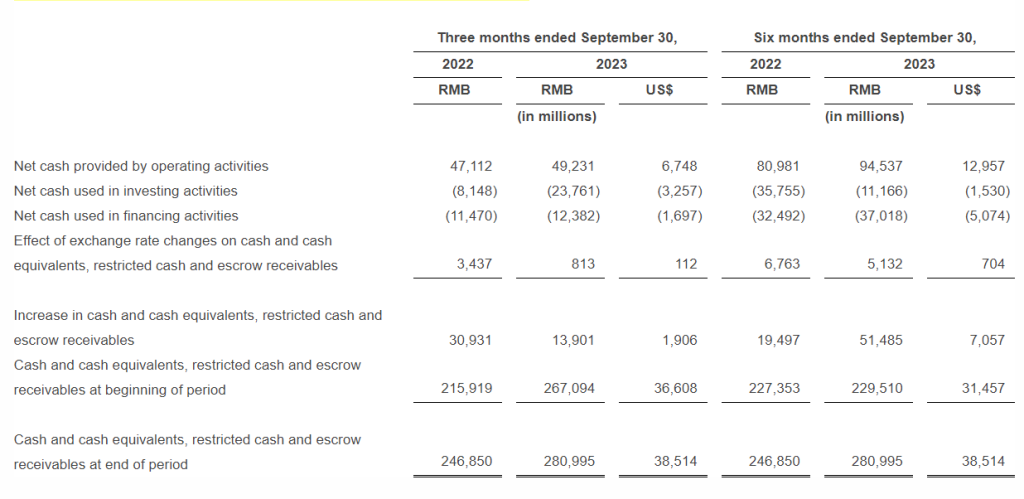
Cash and cash equivalents, short-term investments and other treasury investments
As of September 30, 2023, cash and cash equivalents, short-term investments and other treasury investments included in equity securities and other investments on the consolidated balance sheets, were RMB624,501 million (US$85,595 million), compared to RMB560,314 million as of March 31, 2023. Other treasury investments mainly comprise of investments in fixed deposits and certificates of deposits with original maturities over one year for treasury purposes. The increase in cash and cash equivalents, short-term investments and other treasury investments during the six months ended September 30, 2023 was primarily due to free cash flow generated from operations of RMB84,309 million (US$11,556 million), effect of exchange rate changes of RMB14,247 million (US$1,953 million) mainly due to the appreciation of the U.S. dollar against Renminbi, and net cash provided by investment and acquisition activities of RMB4,789 million (US$656 million), partly offset by cash used in repurchase of ordinary shares of RMB34,025 million (US$4,664 million) and repayment of unsecured senior notes of US$700 million.
Net cash provided by operating activities and free cash flow
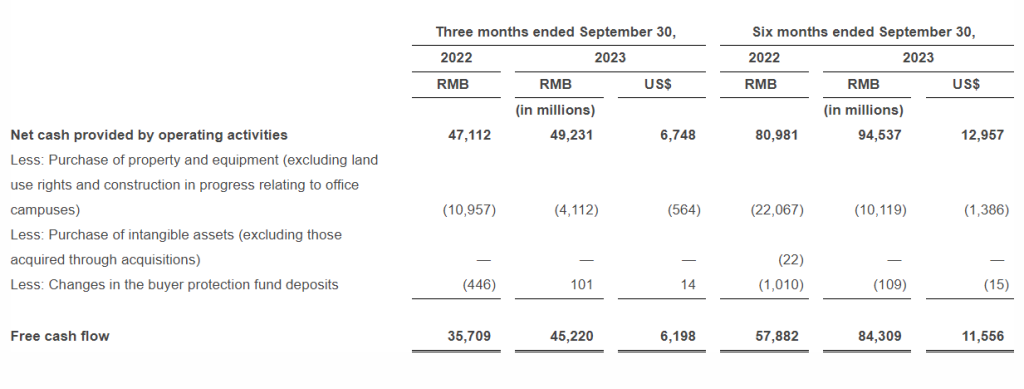
During the quarter ended September 30, 2023, net cash provided by operating activities was RMB49,231 million (US$6,748 million), an increase of 4% compared to RMB47,112 million in the same quarter of 2022. Free cash flow, a non-GAAP measurement of liquidity, was RMB45,220 million (US$6,198 million), an increase of 27% compared to RMB35,709 million in the quarter ended September 30, 2022. The year-over-year increase was primarily due to an increase in profitability and a decrease in capital expenditure, partly offset by net changes in working capital. A reconciliation of net cash provided by operating activities to free cash flow is included at the end of this results announcement.
Net cash used in investing activities
During the quarter ended September 30, 2023, net cash used in investing activities of RMB23,761 million (US$3,257 million) primarily reflected (i) an increase in short-term investments by RMB11,863 million (US$1,626 million), (ii) an increase in other treasury investments by RMB9,342 million (US$1,280 million), (iii) capital expenditure of RMB5,150 million (US$706 million), and (iv) cash outflow of RMB2,776 million (US$381 million) for investment and acquisition activities. These cash outflows were partially offset by cash inflow of RMB4,909 million (US$673 million) from disposal of investments.
Net cash used in financing activities
During the quarter ended September 30, 2023, net cash used in financing activities of RMB12,382 million (US$1,697 million) primarily reflected cash used in repurchase of ordinary shares of RMB11,874 million (US$1,627 million).
Employees
As of September 30, 2023, we had a total of 224,955 employees, compared to 228,675 as of June 30, 2023.
WEBCAST AND CONFERENCE CALL INFORMATION
Alibaba Group’s management will hold a conference call to discuss the financial results at 7:30 a.m. U.S. Eastern Time (8:30 p.m. Hong Kong Time) on Thursday, November 16, 2023.
All participants must pre-register to join this conference call using the Participant Registration link below:
English: https://s1.c-conf.com/diamondpass/10033946-dsb6ko.html
Chinese: https://s1.c-conf.com/diamondpass/10033948-0lkr8u.html
Upon registration, each participant will receive details for the conference call, including dial-in numbers, conference call passcode and a unique access PIN. To join the conference, please dial the number provided, enter the passcode followed by your PIN, and you will join the conference.
A live webcast of the earnings conference call can be accessed at https://www.alibabagroup.com/en-US/ir-financial-reports-quarterly-results. An archived webcast will be available through the same link following the call. A replay of the conference call will be available for one week from the date of the conference (Dial-in number: +1 855 883 1031; English conference PIN 10033946; Chinese conference PIN 10033948).
Please visit Alibaba Group’s Investor Relations website at https://www.alibabagroup.com/en-US/investor-relations on November 16, 2023 to view the earnings release and accompanying slides prior to the conference call.
ABOUT ALIBABA GROUP
Alibaba Group’s mission is to make it easy to do business anywhere. The company aims to build the future infrastructure of commerce. It envisions that its customers will meet, work and live at Alibaba, and that it will be a good company that lasts for 102 years.
EXCHANGE RATE INFORMATION
This results announcement contains translations of certain Renminbi (“RMB”) amounts into U.S. dollars (“US$”) and Hong Kong dollars (“HK$”) for the convenience of the reader. Unless otherwise stated, all translations of RMB into US$ were made at RMB7.2960 to US$1.00, the exchange rate on September 29, 2023 as set forth in the H.10 statistical release of the Federal Reserve Board, and all translations of RMB into HK$ were made at RMB0.91763 to HK$1.00, the middle rate on September 28, 2023 as published by the People’s Bank of China. The percentages stated in this announcement are calculated based on the RMB amounts and there may be minor differences due to rounding.
SAFE HARBOR STATEMENTS
This announcement contains forward-looking statements. These statements are made under the “safe harbor” provisions of the U.S. Private Securities Litigation Reform Act of 1995. These forward-looking statements can be identified by terminology such as “may,” “will,” “expect,” “anticipate,” “future,” “aim,” “estimate,” “intend,” “seek,” “plan,” “believe,” “potential,” “continue,” “ongoing,” “target,” “guidance,” “is/are likely to” and similar statements. In addition, statements that are not historical facts, including statements about Alibaba Group’s new organizational and governance structure, Alibaba’s strategies and business plans, Alibaba’s beliefs, expectations and guidance regarding the growth of its business, revenue and return on investments, the business outlook and quotations from management in this announcement, as well as Alibaba’s strategic and operational plans, are or contain forward-looking statements. Alibaba may also make forward-looking statements in its periodic reports to the U.S. Securities and Exchange Commission (the “SEC”), in announcements made on the website of The Stock Exchange of Hong Kong Limited (the “Hong Kong Stock Exchange”), in press releases and other written materials and in oral statements made by its officers, directors or employees to third parties. Forward-looking statements involve inherent risks and uncertainties. A number of factors could cause actual results to differ materially from those contained in any forward-looking statement. These factors include but are not limited to the following: Alibaba’s corporate structure, including the VIE structure it uses to operate certain businesses in the PRC; the implementation of Alibaba Group’s new organizational and governance structure and the execution of spin-off or capital raising plans of its subsidiaries; Alibaba’s ability to maintain the trusted status of its ecosystem; Alibaba’s ability to compete, innovate and maintain or grow its revenue or business, including expanding its international and cross-border businesses and operations and managing a large and complex organization; risks associated with sustained investments in Alibaba’s businesses; fluctuations in general economic and business conditions in China and globally; uncertainties arising from competition among countries and geopolitical tensions, including protectionist or national security policies and export control, economic or trade sanctions; risks associated with Alibaba’s acquisitions, investments and alliances; uncertainties and risks associated with a broad range of complex laws and regulations (including in the areas of data security and privacy protection, anti-monopoly and anti-unfair competition, content regulation, consumer protection and regulation of Internet platforms) in the PRC and globally; cybersecurity risks; impact of the COVID-19 pandemic; and assumptions underlying or related to any of the foregoing. Further information regarding these and other risks is included in Alibaba’s filings with the SEC and announcements on the website of the Hong Kong Stock Exchange. All information provided in this results announcement is as of the date of this results announcement and are based on assumptions that we believe to be reasonable as of this date, and Alibaba does not undertake any obligation to update any forward-looking statement, except as required under applicable law.
NON-GAAP FINANCIAL MEASURES
To supplement our consolidated financial statements, which are prepared and presented in accordance with GAAP, we use the following non-GAAP financial measures: for our consolidated results, adjusted EBITDA (including adjusted EBITDA margin), adjusted EBITA (including adjusted EBITA margin), non-GAAP net income, non-GAAP diluted earnings per share/ADS and free cash flow. For more information on these non-GAAP financial measures, please refer to the table captioned “Reconciliations of Non-GAAP Measures to the Nearest Comparable U.S. GAAP Measures” in this results announcement.
We believe that adjusted EBITDA, adjusted EBITA, non-GAAP net income and non-GAAP diluted earnings per share/ADS help identify underlying trends in our business that could otherwise be distorted by the effect of certain income or expenses that we include in income from operations, net income and diluted earnings per share/ADS. We believe that these non-GAAP measures provide useful information about our core operating results, enhance the overall understanding of our past performance and future prospects and allow for greater visibility with respect to key metrics used by our management in its financial and operational decision-making. We present three different income measures, namely adjusted EBITDA, adjusted EBITA and non-GAAP net income in order to provide more information and greater transparency to investors about our operating results.
We consider free cash flow to be a liquidity measure that provides useful information to management and investors about the amount of cash generated by our business that can be used for strategic corporate transactions, including investing in our new business initiatives, making strategic investments and acquisitions and strengthening our balance sheet.
Adjusted EBITDA, adjusted EBITA, non-GAAP net income, non-GAAP diluted earnings per share/ADS and free cash flow should not be considered in isolation or construed as an alternative to income from operations, net income, diluted earnings per share/ADS, cash flows or any other measure of performance or as an indicator of our operating performance. These non-GAAP financial measures presented here do not have standardized meanings prescribed by U.S. GAAP and may not be comparable to similarly titled measures presented by other companies. Other companies may calculate similarly titled measures differently, limiting their usefulness as comparative measures to our data.
Adjusted EBITDA represents net income before (i) interest and investment income, net, interest expense, other income, net, income tax expenses and share of results of equity method investees, (ii) certain non-cash expenses, consisting of share-based compensation expense, amortization of intangible assets, depreciation and impairment of property and equipment, and operating lease cost relating to land use rights, impairment of goodwill, as well as equity-settled donation expense which we do not believe are reflective of our core operating performance during the periods presented.
Adjusted EBITA represents net income before (i) interest and investment income, net, interest expense, other income, net, income tax expenses and share of results of equity method investees, (ii) certain non-cash expenses, consisting of share-based compensation expense, amortization of intangible assets, impairment of goodwill and equity-settled donation expense which we do not believe are reflective of our core operating performance during the periods presented.
Non-GAAP net income represents net income before share-based compensation expense, amortization of intangible assets, impairment of goodwill and investments, gain or loss on deemed disposals/disposals/revaluation of investments, equity-settled donation expense and others, as adjusted for the tax effects.
Non-GAAP diluted earnings per share represents non-GAAP net income attributable to ordinary shareholders divided by the weighted average number of outstanding ordinary shares for computing non-GAAP diluted earnings per share on a diluted basis. Non-GAAP diluted earnings per ADS represents non-GAAP diluted earnings per share after adjusting for the ordinary share-to-ADS ratio.
Free cash flow represents net cash provided by operating activities as presented in our consolidated cash flow statement less purchases of property and equipment (excluding acquisition of land use rights and construction in progress relating to office campuses) and intangible assets (excluding those acquired through acquisitions), as well as adjustments to exclude from net cash provided by operating activities the buyer protection fund deposits from merchants on our marketplaces. We deduct certain items of cash flows from investing activities in order to provide greater transparency into cash flow from our revenue-generating business operations. We exclude “acquisition of land use rights and construction in progress relating to office campuses” because the office campuses are used by us for corporate and administrative purposes and are not directly related to our revenue-generating business operations. We also exclude buyer protection fund deposits from merchants on our marketplaces because these deposits are restricted for the purpose of compensating buyers for claims against merchants.
The table captioned “Reconciliations of Non-GAAP Measures to the Nearest Comparable U.S. GAAP Measures” in this results announcement have more details on the non-GAAP financial measures that are most directly comparable to GAAP financial measures and the related reconciliations between these financial measures.
ALIBABA GROUP HOLDING LIMITED
UNAUDITED CONSOLIDATED INCOME STATEMENTS
ALIBABA GROUP HOLDING LIMITED
UNAUDITED CONSOLIDATED BALANCE SHEETS
ALIBABA GROUP HOLDING LIMITED
UNAUDITED CONSOLIDATED BALANCE SHEETS (CONTINUED)
ALIBABA GROUP HOLDING LIMITED
UNAUDITED CONDENSED CONSOLIDATED STATEMENTS OF CASH FLOWS
ALIBABA GROUP HOLDING LIMITED
RECONCILIATIONS OF NON-GAAP MEASURES TO THE NEAREST COMPARABLE U.S. GAAP MEASURES
The table below sets forth a reconciliation of our net (loss) income to adjusted EBITA and adjusted EBITDA for the periods indicated:
ALIBABA GROUP HOLDING LIMITED
RECONCILIATIONS OF NON-GAAP MEASURES TO THE NEAREST COMPARABLE U.S. GAAP MEASURES (CONTINUED)
The table below sets forth a reconciliation of our net (loss) income to non-GAAP net income for the periods indicated:
________________
(1)Tax effects primarily comprise tax effects relating to share-based compensation expense, amortization of intangible assets and certain gains and losses from investments, and others.
ALIBABA GROUP HOLDING LIMITED
RECONCILIATIONS OF NON-GAAP MEASURES TO THE NEAREST COMPARABLE U.S. GAAP MEASURES (CONTINUED)
The table below sets forth a reconciliation of our diluted (loss) earnings per share/ADS to non-GAAP diluted earnings per share/ADS for the periods indicated:
________________
(1)See the table above for the reconciliation of net (loss) income to non-GAAP net income for more information of these non-GAAP adjustments.
(2)Each ADS represents eight ordinary shares.
(3)Diluted (loss) earnings per share is derived from dividing net (loss) income attributable to ordinary shareholders by the weighted average number of outstanding ordinary shares, on a diluted basis. Diluted (loss) earnings per ADS is derived from the diluted (loss) earnings per share after adjusting for the ordinary share-to-ADS ratio.
(4)Non-GAAP diluted earnings per share is derived from dividing non-GAAP net income attributable to ordinary shareholders by the weighted average number of outstanding ordinary shares for computing non-GAAP diluted earnings per share, on a diluted basis. Non-GAAP diluted earnings per ADS is derived from the non-GAAP diluted earnings per share after adjusting for the ordinary share-to-ADS ratio.
ALIBABA GROUP HOLDING LIMITED
RECONCILIATIONS OF NON-GAAP MEASURES TO THE NEAREST COMPARABLE U.S. GAAP MEASURES (CONTINUED)
The table below sets forth a reconciliation of net cash provided by operating activities to free cash flow for the periods indicated:
Contacts
Investor Relations Contact
Rob Lin
Head of Investor Relations
Alibaba Group Holding Limited
investor@alibaba-inc.com
Media Contacts
Cathy Yan
cathy.yan@alibaba-inc.com
Ivy Ke
ivy.ke@alibaba-inc.com